|
Weekly |
| |
Day |
Hits |
% |
Bytes |
% |
Sessions |
Visitors |
Pages |
Errors |
|
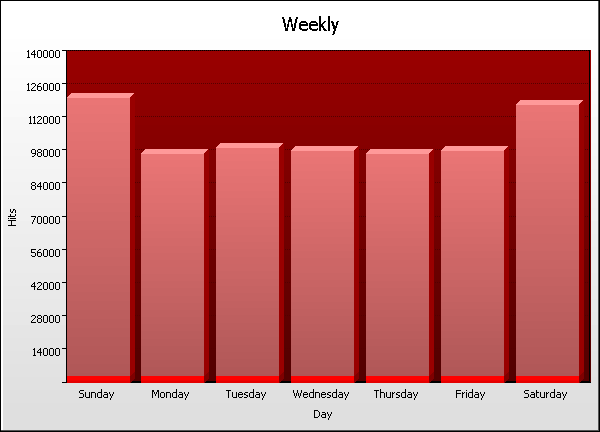
1 |
Sunday |
|
|
14,072 |
11,362 |
67,994 |
3,869 |
|
2 |
Monday |
|
|
12,170 |
10,115 |
54,839 |
3,050 |
|
3 |
Tuesday |
|
|
12,429 |
10,185 |
57,139 |
3,528 |
|
4 |
Wednesday |
|
|
12,511 |
10,213 |
55,982 |
3,300 |
|
5 |
Thursday |
|
|
12,182 |
10,101 |
54,839 |
3,459 |
|
6 |
Friday |
|
|
12,607 |
10,388 |
55,712 |
3,369 |
|
7 |
Saturday |
|
|
13,684 |
11,034 |
66,528 |
3,976 |
| |
Average |
|
|
12,807 |
10,485 |
59,004 |
3,507 |
|
7 |
Totals |
|
|
89,525 |
43,850 |
413,033 |
24,551 |
|
|