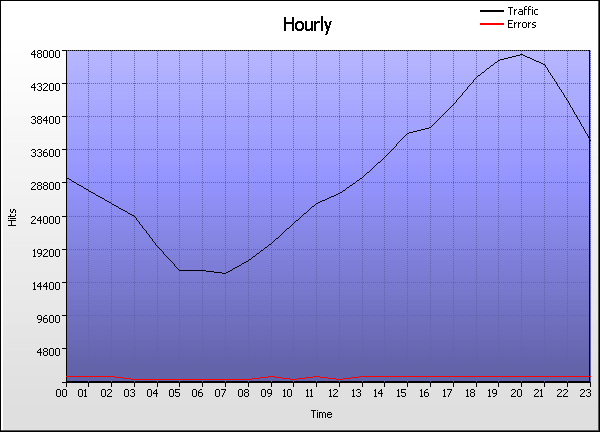
Time Graph
Go the Help Card.


Hourly
  Time Hits % Bytes % Sessions Visitors Pages Errors
1 00:00 - 00:59
30,148    4.11%
0    0%
3,895 3,649 17,118 1,045
2 01:00 - 01:59
27,913    3.81%
0    0%
3,736 3,503 15,751 1,023
3 02:00 - 02:59
26,206    3.58%
0    0%
3,493 3,297 14,860 964
4 03:00 - 03:59
24,275    3.31%
0    0%
3,154 2,968 13,740 904
5 04:00 - 04:59
20,044    2.73%
0    0%
2,826 2,681 11,462 837
6 05:00 - 05:59
16,643    2.27%
0    0%
2,450 2,297 9,625 759
7 06:00 - 06:59
16,511    2.25%
0    0%
2,282 2,142 9,626 716
8 07:00 - 07:59
16,138    2.20%
0    0%
2,353 2,214 9,325 679
9 08:00 - 08:59
18,144    2.48%
0    0%
2,660 2,498 10,521 804
10 09:00 - 09:59
20,545    2.80%
0    0%
2,812 2,677 11,782 1,008
11 10:00 - 10:59
23,389    3.19%
0    0%
2,991 2,834 13,458 756
12 11:00 - 11:59
26,250    3.58%
0    0%
3,401 3,206 14,894 972
13 12:00 - 12:59
27,482    3.75%
0    0%
3,572 3,376 15,412 866
14 13:00 - 13:59
30,175    4.12%
0    0%
3,805 3,586 16,905 961
15 14:00 - 14:59
32,646    4.45%
0    0%
4,117 3,882 18,313 1,011
16 15:00 - 15:59
36,450    4.97%
0    0%
4,531 4,286 20,382 1,123
17 16:00 - 16:59
37,407    5.10%
0    0%
4,486 4,219 20,828 1,127
18 17:00 - 17:59
40,785    5.56%
0    0%
5,070 4,781 22,732 1,204
19 18:00 - 18:59
44,352    6.05%
0    0%
5,328 5,038 24,797 1,356
20 19:00 - 19:59
46,640    6.36%
0    0%
5,447 5,138 26,071 1,397
21 20:00 - 20:59
47,863    6.53%
0    0%
5,591 5,287 26,767 1,303
22 21:00 - 21:59
46,410    6.33%
0    0%
5,361 5,036 25,827 1,300
23 22:00 - 22:59
41,209    5.62%
0    0%
5,078 4,768 23,034 1,218
24 23:00 - 23:59
35,282    4.81%
0    0%
4,392 4,130 19,803 1,218
  Average
30,537    4.17%
0    0%
3,867 3,645 17,209 1,022
24 Totals
732,907    100%
0    0%
89,525 43,850 413,033 24,551
Go the Help Card.

Help Card: Hourly
Report Overview This report provides a snapshot of traffic for each hour of the day. Use this information to find the most popular hours, which can be used to determine when system uptime is most crucial.

This report may be affected by world time zones. Many webservers generate timestamps in Greenwich Mean Time (GMT+0), which may not be your local time zone. The time data in your logs can be adjusted to represent your local time zone, in Settings > Analysis > Options > Date range > Time adjust.

Graph Description Vertical axis: Hits (default sorting).
Number of hits to the site. Changing the sorting options in Settings > Statistics will alter the vertical axis to the new sort method (Visitors, Bytes, etc). This report may be sorted by hits, bytes, sessions, visitors, pages or errors.

Horizontal axis: Time
The hourly periods of a day.

Red line (if present):
HTTP errors (Page not found, server error, etc)

Table Description Time:
The hourly period as the focus of this report.

Hits (%):
Number of hits to the site during the corresponding hourly period. (Percentage as a proportion of hits to the site during the day's 24 hours.)

Bytes (%):
Number of bytes transferred as a result of hits to the site during the corresponding hourly period. For readability, these values may be suffixed with kilobytes (KB), megabytes (MB) or gigabytes (GB), where applicable. (Percentage as a proportion of bytes transferred during the day's 24 hours.)

Sessions:
Total number of sessions undertaken during the corresponding hourly period. This number includes sessions undertaken by 'repeat' visitors. Note that he total of this column represents an overall session count for the entire period including those sessions overlapping hourly time periods. For this reason, the total of this column may appear smaller than the figure when adding up each row individually.

Visitors:
Total number of unique visitors who participated in sessions during the corresponding hourly period. Note that this figure represents a unique hourly visitor count, not a unique daily visitor count (as a unique visitor for one hour may return in another hour). As such, the "Totals" value will be cumulative for the 24 hours and the overall total for individual rows may be more than in the Totals row.

Pages:
Number of pages viewed during the corresponding hourly period.

Errors:
Number of server errors generated as a result of hits to the site during the corresponding hourly period.
Go back to the top.

Copyright © Quest Software , 1997-2002